
Table of Contents
Under the federal Community Reinvestment Act (CRA), the Federal Deposit Insurance Corporation (FDIC) evaluates our record of helping to meet the credit needs of this community consistent with safe and sound operations. The FDIC also takes this record into account when deciding on certain applications submitted by us.
Your involvement is encouraged.
You are entitled to certain information about our operations and our performance under the CRA, including, for example, information about our branches, such as their location and services provided at them; the public section of our most recent CRA Performance Evaluation, prepared by the FDIC; and comments received from the public relating to our performance in helping to meet community credit needs, as well as our responses to those comments. You may review this information today.
At least 30 days before the beginning of each quarter, the FDIC publishes a nationwide list of the banks that are scheduled for CRA examination in that quarter. This list is available from the Regional Director, FDIC, 25 Jessie Street at Ecker Square, Suite 2300, San Francisco, CA 94105. You may send written comments about our performance in helping to meet community credit needs to Stacey Craghead, Vice President, Community Commerce Bank, 358 Foothill Blvd., Claremont, CA 91711 and FDIC Regional Director. You may also submit comments electronically through the FDIC’s Web site at www.fdic.gov/regulations/cra. Your letter, together with any response by us, will be considered by the FDIC in evaluating our CRA performance and may be made public.
You may ask to look at any comments received by the FDIC Regional Director. You may also request from the FDIC Regional Director an announcement of our applications covered by the CRA filed with the FDIC.
This section contains all written comments received from the public for the current year and each of the prior two calendar years that specifically relate to the Bank’s performance in helping to meet community credit needs, and any response to the comments by the Bank, if neither the comments nor the responses contain statements that reflect adversely on the good name or reputation of any persons other than the Bank or publication of which would violate specific provisions of law.
2024: NO WRITTEN COMMENTS (to date)
2023: NO WRITTEN COMMENTS
2022: NO WRITTEN COMMENTS
This section contains a copy of the public section of the bank’s most recent CRA Performance Evaluation prepared by the FDIC as of November 23, 2020.
Community Commerce Bank
Certificate Number: 26363
358 West Foothill Boulevard
Claremont, California 91711
Federal Deposit Insurance Corporation
Division of Depositor and Consumer Protection
San Francisco Regional Office
25 Jessie Street at Ecker Square, Suite 2300
San Francisco, California 94105
This document is an evaluation of this institution’s record of meeting the credit needs of its entire community, including low- and moderate-income neighborhoods, consistent with safe and sound operation of the institution. This evaluation is not, nor should it be construed as, an assessment of the financial condition of this institution. The rating assigned to this institution does not represent an analysis, conclusion, or opinion of the federal financial supervisory agency concerning the safety and soundness of this financial institution.
INSTITUTION’S CRA RATING: This institution is rated Outstanding.
An institution in this group has an outstanding record of helping to meet the credit needs of its assessment area, including low- and moderate-income neighborhoods, in a manner consistent with its resources and capabilities.
The Lending Test is rated Outstanding.
DESCRIPTION OF INSTITUTION
CCB is a minority industrial loan company headquartered in Claremont, California. CCB is 98 percent owned by The East Los Angeles Community Union (TELACU), Industries Incorporated, a wholly owned profit-oriented subsidiary of TELACU, a California private non-profit corporation. TELACU primarily serves low-income communities in Southern California and is one of the largest community development corporations in the United States. It has been in operation for over 50 years.
CCB was founded for the express purpose of serving the credit needs of the local community. In addition to the administrative office, which is located in an upper-income census tract (CT), CCB operates three full-service branch offices in Southern California. Branches located in Claremont and Tarzana are situated in upper-income CTS, and the Monterey Park branch is located in a middle income CT. Since the prior evaluation, CCB closed the Woodland Hills branch and opened the Tarzana branch in December 2016. No merger or acquisition activities occurred since the previous evaluation. CCB received a “Satisfactory” rating at its previous FDIC Performance Evaluation based on the Interagency Small Institution Examination Procedures.
CCB provides statement savings accounts and time deposit accounts. The bank specializes in construction loans, commercial real estate loans, loans to non-profits and religious organizations, and other real estate lending for both consumer (commercial properties) and business purposes. CCB has been an approved Small Business Administration (SBA) 7(a) lender since 2015. CCB operates a website that allows borrowers to initiate an ACH payment for their loan payment.
CCB’s assets totaled approximately $338.4 million as of September 30, 2020, and included total loans of $254.1 million and total securities of $142.0 million. The bank reported deposits of $203.5 million. The distribution of the loan portfolio by loan type is illustrated in the following table.
| Loan Category | ||||||||||
| Construction, Land Development, and Other Land Loans | ||||||||||
| Secured by Farmland | ||||||||||
| Secured by 14 Family Residential Properties | ||||||||||
| Secured by Multifamily (5 or more) Residential Properties | ||||||||||
| Secured by Nonfarm Nonresidential Properties | ||||||||||
| Total Real Estate Loans | ||||||||||
| Commercial and Industrial Loans | ||||||||||
| Agricultural Production and Other Loans to Farmers | ||||||||||
| Consumer Loans | ||||||||||
| Obligations of State and Political Subdivisions in the U.S. | ||||||||||
| Other Loans | ||||||||||
| Lease Financing Receivable (net of unearned income) | ||||||||||
| Less: Unearned Income | ||||||||||
| Total Loans | ||||||||||
| Source: Reports of Condition and Income | ||||||||||
Examiners did not identify any financial, legal, or other impediments that affect the bank’s ability to meet AA credit needs.
DESCRIPTION OF ASSESSMENT AREA
CCB’s AA is comprised of the contiguous area consisting of Los Angeles, Orange, Riverside, and San Bernardino Counties. These four counties are contained in the Los Angeles-Long Beach, California combined statistical area (CSA) #346. The CSA includes the following metropolitan divisions ODs) or metropolitan statistical areas (MSAs): 1) Los Angeles-Long Beach-Glendale, CA #31084 (Los Angeles County); 2) Riverside-San Bernardino-Ontario, CA MSA #40140 (San Bernardino and Riverside Counties); and 3) Anaheim-Santa Ana-Irvine, CA MD #11244 (Orange County).
The AA complies with all of the technical requirements of the CRA regulation by containing whole geographies, does not reflect illegal discrimination, and does not arbitrarily exclude any low- and moderate-income (LMI) areas. The AA is densely populated and economically and demographically diverse. Management selected these geographies based on the location of the bank’s offices and the expectation of attracting and retaining a consumer base within these geographies.
Economic and Demographic Data
Los Angeles County
Based on Moody’s Analytics published as of August 2020, the Los Angeles County economy is recovering from a recession after the devastating effects of the COVID-19 pandemic on the area and labor market. The unemployment rate was among the highest in the county at 17.5 percent as of July 2020. State and locally mandated lockdowns have crippled nonessential businesses, with the leisure/hospitality industry experiencing the greatest job losses. The seaports of Los Angeles and Long Beach are vital economic drivers that were already negatively impacted by the trade war going into the pandemic. Year-to-date cargo volumes rose slightly in July but were down compared to 2019. The July increase was driven by imports; exports remained especially weak. The main economic drivers for the Los Angeles area include the tourism, logistics, and medical industries. Economic strengths include a strong healthcare base and a growing technology presence; global links through entertainment, tourism, and fashion; and the advantage of the San Pedro Harbor to handle megaships that other ports cannot. Economic weaknesses include high costs that hinder net migration gains and that the area is prone to natural disasters, including drought, wildfires, and earthquakes. The top employers include the Cedars-Sinai Medical Center, Los Angeles International Airport, University of California, Los Angeles, VXI Global Solutions, and the Walt Disney Company.
Orange County
Based on Moody’s Analytics published as of August 2020, the Orange County economy is also recovering from a recession after the devastating effects of the COVID-19 pandemic on the area and labor market. Payroll employment plummeted 16.5 percent at the peak of the pandemic in April; no industry was untouched, but leisure/hospitality was hardest hit with a 46 percent drop. While the unemployment rate is falling slowly at 13.5 percent as of June 2020, the labor force is still far below its pre-pandemic levels and only about one-quarter of the jobs lost in March and April have been recouped. As one of the area’s leading employers, the closure of Disneyland for the past seven months has left thousands of employees furloughed. The move to virtual learning and the 13 percent reduction in funding by the Governor has lead the area’s second largest employer, the University of California— Irvine, to consider salary cuts, furloughs or layoffs to reduce spending. Passenger counts at John Wayne Airport were down 75 percent from a year earlier in July. Hotel occupancy rates are also deeply depressed and caution by travelers will weigh on airlines and hotels even as the economy rebounds. The main economic drivers for Orange County include the tourism, technology, and medical industries. Economic strengths include a highly trained and well-educated workforce, research and development clusters underpin the demand for offce space, and the coastline and climate attract residents and visitors. Economic weaknesses include theme parks closed through the end of the year, and tourists being more hesitant to travel. The top employers include the Disney Resorts, University of California, Irvine, St Joseph Health, Kaiser Permanente, and Target Brands Inc.
Riverside-San Bernardino Counties
Based on Moody’s Analytics published as of August 2020, the Riverside-San Bernardino Counties economy is slowly recovering from a recession after the devastating effects of the COVID-19 pandemic on the area and labor market. The decimated leisure/hospitality industry has been the main drag on job growth. The unemployment rate has come down very little in recent months. Logistics will keep the recovery moving. Among the 65 metro areas or divisions with at least 1 million residents, Riverside-San Bernardino boasts the second-highest share of jobs in transportation and warehousing. Proximity to Southern California’s biggest cities and cheaper land costs make Riverside-San Bernardino an ideal distribution point for major retailers. The pandemic’s severity was minimized because Target, Walmart, and Amazon were classified as essential employers during the start of the COVID-19 shutdowns, allowing their Riverside-San Bernardino warehouses to remain open. The outlook for logistics is bright given the importance of e-commerce in helping consumers weather the pandemic. Economic strengths of the area include comparative advantage in transportation, distribution, and warehousing; lower business and housing costs than in nearby coastal areas; and a young population with a positive net migration. Economic weaknesses include lack of a central core downtown, low per capita income and poorly educated workforce, and lack of knowledge-based industries. The top employers include the Stater Brothers, Arrowhead Regional Medical Center, U.S. Marine Corps Air Ground Combat Center, Fort Irwin, Walmart, and University of California, Riverside.
Demographics
Based on 2015 American Community Survey (ACS) data, the AA consists of 3,751 CTS, of which 309 are low-income, 1,067 are moderate-income, 1,061 are middle-income, 1,254 are upper income, and 60 do not have an income designation. The following table illustrates demographic information within the AA.
| Demographic Characteristics | % of # |
% of # |
% of # |
% of # |
% of # |
|
| Geographies (Census Tracts) | ||||||
| Population by Geography | ||||||
| Housing Units by Geography | ||||||
| Owner-Occupied Units by Geography | ||||||
| Occupied Rental Units by Geography | ||||||
| Vacant Units by Geography | ||||||
| Businesses by Geography | ||||||
| Farms by Geography | ||||||
| Family Distribution by Income Level | ||||||
| Household Distribution by Income Level | ||||||
| Median Family Income – MSA 31084 Los Angeles-Long Beach-Glendale, CA | Median Housing Value | |||||
| Median Family Income – MSA 40140 Riverside-San Bernardino-Ontario, CA | Median Gross Rent | |||||
| Median Family Income – MSA 11244 Anaheim-Santa Ana-Irvine, CA | Families Below Poverty Level | |||||
| Source: 2015 ACS and 2019 DU Data. Due to rounding, totals may not equal 100.0%. (*) The NA category consists of geographies that have not been assigned an income classification. | ||||||
According to 2019 D&B data, there are 1,470,537 businesses in the AA , of which 85.8 percent have gross annual revenues (GARs) of $ 1.0 million or less, 7.8 percent have GARs above $1.0 million, and 6.4 percent have unknown revenues. The services industry represents the largest portion of businesses at 39.0 percent, followed by non-classifiable industries at 21.8 percent, and retail trade at 11.6 percent. Additionally, 62.0 percent of area businesses have 4 or fewer employees and 92.5 percent of area businesses operate from a single location.
Competition
CCB operates in a highly competitive market that includes a number of large national and regional financial institutions within the AA. According to the June 30, 2020 Deposit Market Share Report, 123 financial institutions operated 2,847 branches inside the AA. Of these institutions, CCB ranked 92nd with less than one percent of the deposit market share. The top five institutions in the AA control approximately 59.3 percent of the deposit market share and approximately 54.4 percent of the branches.
CCB is not required to report small business lending data and has not elected to do so. Although reported data is an indicator of competition and demand for small business loans in the AA, data for 2019 small business lending is not available as of the evaluation date.
Community Contact
As part of the evaluation process, examiners contact third parties to assist in identifying the credit needs of the AA. Examiners conducted a community contact interview with a small business development organization that provides SBA 504 loans and access to working capital for clients not typically eligible for bank financing. The contact identified that small business loans remain a primary credit need for both existing and new businesses during the COVID-19 pandemic. The contact stated that financing requests for restaurants, start-up businesses, online retail, and healthcare services have increased. The contact indicated that opportunities exist for financial institutions to provide start-up loans, micro-loans, and other short-term small business credit assistance within the AA. In addition to new lending, relief for current loans and flexibility on the payment side were also identified as a significant need.
Credit Needs
Examiners determined that small business loans represent a primary credit need in the AA.
Information gathered from community contacts, bank management, and demographic and economic data support this conclusion. The AA consists of a large percentage of small businesses and there is a considerable need for micro-loans. Opportunities for small business lending and other credit-related projects are present throughout the AA.
SCOPE OF EVALUATION
General Information
This evaluation covers the period from the prior evaluation dated January 11, 2016, to the current evaluation dated November 23, 2020. Examiners used the Interagency Small Institution Examination Procedures to evaluate CCB’s CRA performance. This Evaluation does not include any affiliate lending activity.
The Lending Test considered the institution’s performance according to the following criteria: loan-to-deposit ratio, AA concentration, geographic distribution, borrower profile, and response to CRA-related complaints.
Activities Reviewed
Examiners determined that the CCB’s major product line is small business loans. This conclusion considered the bank’s business strategy and the number and dollar volume of loans originated and purchased during the evaluation period.
According to the September 30, 2020 Consolidated Report of Condition and Income (Call Report), commercial real estate and commercial/industrial loans represent 65.8 percent of the bank’s loan portfolio and consumer loans and multi-family loans represent 14.2 percent and 11.8 percent, respectively. CCB’s consumer loans are comprised entirely of purchased auto loan contracts secured by vintage vehicles. Consumer loans will not be included in this CRA review, as specialty car lending is not a major business line of the bank. Although multi-family loans represent 11.8 percent of the loan portfolio, they will not be included in the review due to the nominal volume by both number and dollar amount relative to small business lending. The bank did not originate any farm loans or consumer loans during the review period.
Bank records indicate that the lending focus and product mix remained consistent throughout the evaluation period. Examiners reviewed and analyzed the universe of small business loans originated in the period of January 1, 2018, through December 31, 2019. The bank originated 42 small business loans in 2018 totaling $17.3 million, and 30 small business loans in 2019 totaling $12.8 million. This represents an increase from the lending levels at the prior evaluation when the bank originated 23 small business loans totaling $10.3 million for the years 2014 through 2015.
Examiners did not identify any small business lending trends between 2018 and 2019 that would materially affect overall conclusions; therefore, this evaluation only presents information regarding CCB’s 2019 small business lending performance for geographic distribution and borrower profile.
Examiners analyzed both the number and dollar volume of loans originated. While number and dollar volume of loans are presented, examiners emphasized performance by number of loans as this is generally a better indicator of the number of businesses sewed. Additionally, the percentage by dollar volume is generally consistent with the percentage by number of loans.
Examiners relied on CCB’s financial records, Reports of Condition and Income, demographic data from the 2015 ACS Census data, 2019 D&B Data, the institution’s small business loan data, regulatory data from the FDIC, and information gathered from community contacts.
CONCLUSIONS ON PERFORMANCE CRITERIA
Lending Test
CCB’s Lending Test is rated Outstanding. Performance under the Loan-to-Deposit Ratio, AA Concentration, Geographic Distribution, and Borrower Profile criteria support this conclusion.
Loan-to-Deposit Ratio
CCB’s average net LTD ratio is more than reasonable given the institution’s asset size, financial condition, competition, and AA credit needs. The institution’s net LTD ratio averaged 120.0 percent over the prior 19 calendar quarters from March 31, 2016 through September 30, 2020. The ratio ranged from a low of 107.9 percent as of June 30, 2019, to a high of 128.4 percent as of March 31, 2016, and has generally remained stable throughout the evaluation period. CCB’s average LTD ratio is above that of the identified similarly situated intuition by 32.2 percent.
| Bank | as of 09/30/2020 ($000s) |
|||||||||
| Community Commerce Bank | ||||||||||
| Similarly – Situated Institution #1 | ||||||||||
| Source: Reports of Condition and Income 3/31/2016 – 9/30/2020 | ||||||||||
Assessment Area Concentration
CCB originated a majority of small business loans within its AA by both number and dollar volume. The following table shows that the bank originated 76.4 percent by number and 76.3 percent by dollar volume of small business loans inside its AA during the evaluation period.
| Loan Category | Total | Total $ (000s) | ||||||||
| Small Business | ||||||||||
| 2018 | ||||||||||
| 2019 | ||||||||||
| Subtotal | ||||||||||
| Total | ||||||||||
| Source: Bank Data. Due to rounding totals may not equal 100.0% | ||||||||||
Geographic Distribution
The geographic distribution of loans reflects excellent dispersion throughout the bank’s AA. The following table illustrates the bank’s geographic distribution of small business loans by CT income level.
| Tract Income Level | % of Businesses | # | % | $(000s) | % |
| Low | |||||
| 2019 | 4.7 | 3 | 14.3 | 907 | 10.7 |
| Moderate | |||||
| 2019 | 20.0 | 11 | 52.4 | 3,967 | 46.6 |
| Middle | |||||
| 2019 | 26.6 | 3 | 14.3 | 1,578 | 18.5 |
| Upper | |||||
| 2019 | 47.2 | 3 | 14.3 | 1,404 | 16.5 |
| Not Available | |||||
| 2019 | 1.6 | 1 | 4.8 | 660 | 7.8 |
| Totals | |||||
| 2019 | 100.0 | 21 | 100.0 | 8,516 | 100.0 |
| Source: 2019 Bank Data. Due to rounding totals may not equal 100.0% | |||||
In 2019, CCB originated three small business loans in low-income CTS. CCB’s lending in low-income CTS at 14.3 percent is 9.6 percentage points greater than the percent of businesses in the in 2019, CCB originated 11 small business loans in moderate-income CTS. CCB’s lending in moderate-income CTS at 52.4 percent is significantly greater than businesses in the AA by 32.4 percentage points.
The bank’s level of small business lending showed a slight decrease by number volume from 2018 to 2019 but lending in moderate-income CTS increased by 8.3 percentage points in 2019.
While not used as a direct benchmark for small bank lending performance, aggregate lending data is a good tool to gauge small business loan demand in the AA. In 2018, CCB exceeded the aggregate performance of 4.4 percent in low-income CTS with lending at 23.5 percent. Similarly, the bank’s 2018 small business lending in moderate-income CTS at 44.1 percent exceeded the aggregate performance by 23.6 percentage points. Aggregate data for 2019 small business lending was not available as of the evaluation date.
CCB’s level of small business lending, particularly in moderate-income CTS reflects favorably on AA lending performance. Overall, this demonstrates excellent dispersion throughout the AA and is an improvement from the prior evaluation’s rating of reasonable.
Borrower Profile
The distribution of borrowers reflects, given the demographics of the AA, excellent penetration among businesses of different revenue sizes. CCBs small business lending performance is compared to businesses with GARs of less than or equal to $1 million as reported in 2019 D&B data.
| Gross Revenue Level | % of Businesses | # | % | $(000s) | % |
| <= $1,000,000 | |||||
| 2019 | 88.6 | 21 | 100.0 | 8,516 | 100.0 |
| > $1,000,000 | |||||
| 2019 | 4.8 | 0 | 0.0 | 0 | 0.0 |
| Revenue Not Available | |||||
| 2019 | 6.5 | 0 | 0.0 | 0 | 0.0 |
| Totals | |||||
| 2019 | 100.0 | 21 | 100.0 | 8,516 | 100.0 |
| Source: 2019 D&B Data; Bank Data. Due to rounding totals may not equal 100.0% | |||||
In 2019, all of CCB’s small business loans were to small businesses with GARs of $1 million or less, which is more than the percentage of small businesses within the AA as reported by D&B at 88.6 percent.
Although the number of originations decreased from 33 loans to 21 loans between 2018 and 2019, both the number volume and dollar volume of lending to businesses with GARs of $1 million or less increased, by 2.9 percentage points and 1.7 percentage points respectively.
While not used as a direct benchmark for small bank lending performance, aggregate lending data is a good tool to gauge small business loan demand in the AA. In 2018, aggregate lending data showed that 47.0 percent of small business loans were to businesses with GARs of $1 million or less in the AA by institutions required to report such data. CCB’s 2018 small business lending performance of 97.1 percent by number volume and 98.3 percent by dollar volume is significantly above aggregate data. Aggregate data for 2019 was not available as of the date of this evaluation; however, the trend analysis of CCBs performance is favorable.
Response to Complaints
The institution has not received any CRA-related complaints since the previous evaluation; therefore, this criterion did not affect the rating.
DISCRIMINATORY OR OTHER ILLEGAL CREDIT PRACTICES REVIEW
The bank’s compliance with the laws relating to discrimination and other illegal credit practices was reviewed, including the Fair Housing Act and the Equal Credit Opportunity Act. Examiners did not identify any discriminatory or other illegal credit practices; therefore, this consideration did not affect the institution’s overall CRA Rating.
SMALL BANK PERFORMANCE CRITERIA
Lending Test
The Lending Test evaluates the bank’s record of helping to meet the credit needs of its assessment area(s) by considering the following criteria:
This section contains a list of the Bank’s branches, their street addresses, and geographies.
Corporate Headquarters
Address: 358 W. Foothill Blvd., Claremont, CA 91711
MSA/MD Code: 31084 (Los Angeles‐Long Beach‐Glendale, CA)
Census Tract: 4019.02
Tract Income Level: Upper
Claremont Branch
Address: 390 W. Foothill Blvd., Claremont, CA 91711
MSA/MD Code: 31084 (Los Angeles‐Long Beach‐Glendale, CA)
Census Tract: 4019.02
Tract Income Level: Upper
Tarzana Branch
Address: 19538 Ventura Blvd., Tarzana, CA 91356
MSA/MD Code: 31084 (Los Angeles‐Long Beach‐Glendale, CA)
Census Tract: 1394.02
Tract Income Level: Upper
Monterey Park Branch
Address: 2325 S. Atlantic Blvd., Monterey Park, CA 91754
MSA/MD Code: 31084 (Los Angeles‐Long Beach‐Glendale, CA)
Census Tract: 4827.01
Tract Income Level: Middle
This section contains a list of branches opened or closed by the Bank during the current year and each of the prior two calendar years, their street addresses, and geographies.
Branches Closed
Monterey Park Branch, California State
Address: 2323 S. Atlantic Blvd., Monterey Park, CA 91754
MSA/MD Code: 31084 (Los Angeles‐Long Beach‐Glendale, CA)
Census Tract: 4827.01
Tract Income Level: Middle
Closed: January 2023
Branches Opened
Monterey Park Branch, California State
Address: 2325 S. Atlantic Blvd., Monterey Park, CA 91754
MSA/MD Code: 31084 (Los Angeles‐Long Beach‐Glendale, CA)
Census Tract: 4827.01
Tract Income Level: Middle
Opened: February 2023
This section contains a list of services (including hours of operation, available loan and deposit products, and transaction fees) generally offered at the Bank’s branches and descriptions of material differences in the availability or cost of services at particular branches, if any.
Branch Hours of Operation
Claremont Branch
Address: 390 W. Foothill Blvd., Claremont, CA 91711
Telephone: (909) 625 – 7891
Hours: 9:00 am – 5:00 pm (Monday – Friday)
Monterey Park Branch
Address: 2325 S. Atlantic Blvd., Monterey Park, CA 91754
Telephone: (323) 268 – 6100
Hours: 9:00 am – 5:00 pm (Monday – Friday)
Tarzana Branch
Address: 19538 Ventura Blvd., Tarzana, CA 91356
Telephone: (818) 992 – 5661
Hours: 9:00 am – 5:00 pm (Monday – Friday)
Loan Products Available
Commercial Property Loans
Real estate financing solutions to meet your purchase, refinance, or equity loan needs for office, retail, manufacturing, automotive, and other commercial structures.
Single Family Residence (1-4 units) Loans
Supporting non-owner occupied SFR, condos, townhomes, duplexes, triplexes, quadplexes, or owner occupied not subjected to RESPA. LLCs and Corporations OK.
Apartment / Multi-Family (5+ units) Loans
Lending against a wide variety of multi-unit residential or apartment buildings with 5 or more units for purchase, refinance or cash-out options.
Mixed Use Property Loans
Any combination of spaces intentionally used for retail/office and residential on the same property will qualify.
House Of Worship Loans
Specialized lending programs are available for places of worship, single-use buildings for congregation or local gathering of religious believers.
SBA 7(a) Program Loans
Financing for small businesses that operate for profit in the U.S. for purchase or refinance of real estate, business acquisition, equipment purchase, inventory purchase, or working capital.
Savings Products Available
Savings Accounts
Time Deposits Accounts
General Terms and Conditions
Deposit and Holds
Fees
Withdrawals
Escheat of Accounts
This section contains a list of alternative systems for delivering retail banking services.
Alternative Services Available
Online and Mobile Banking
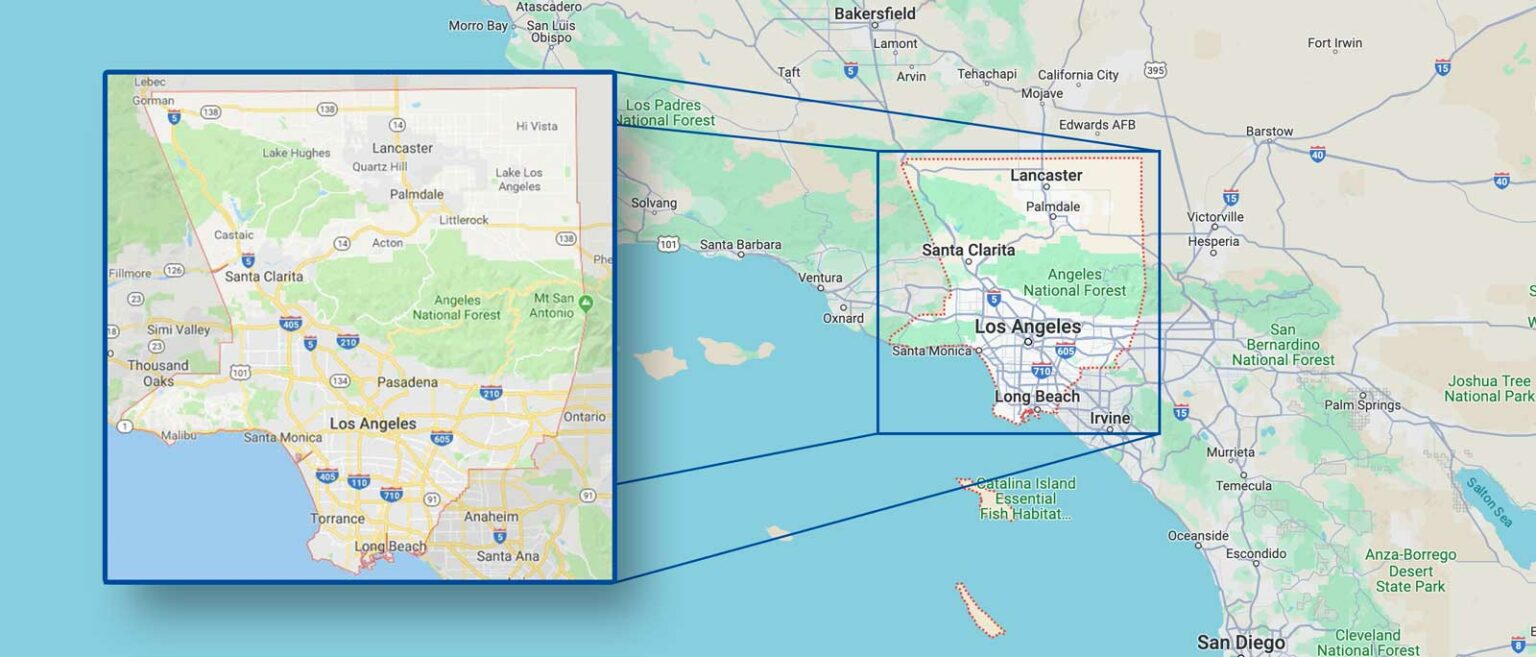
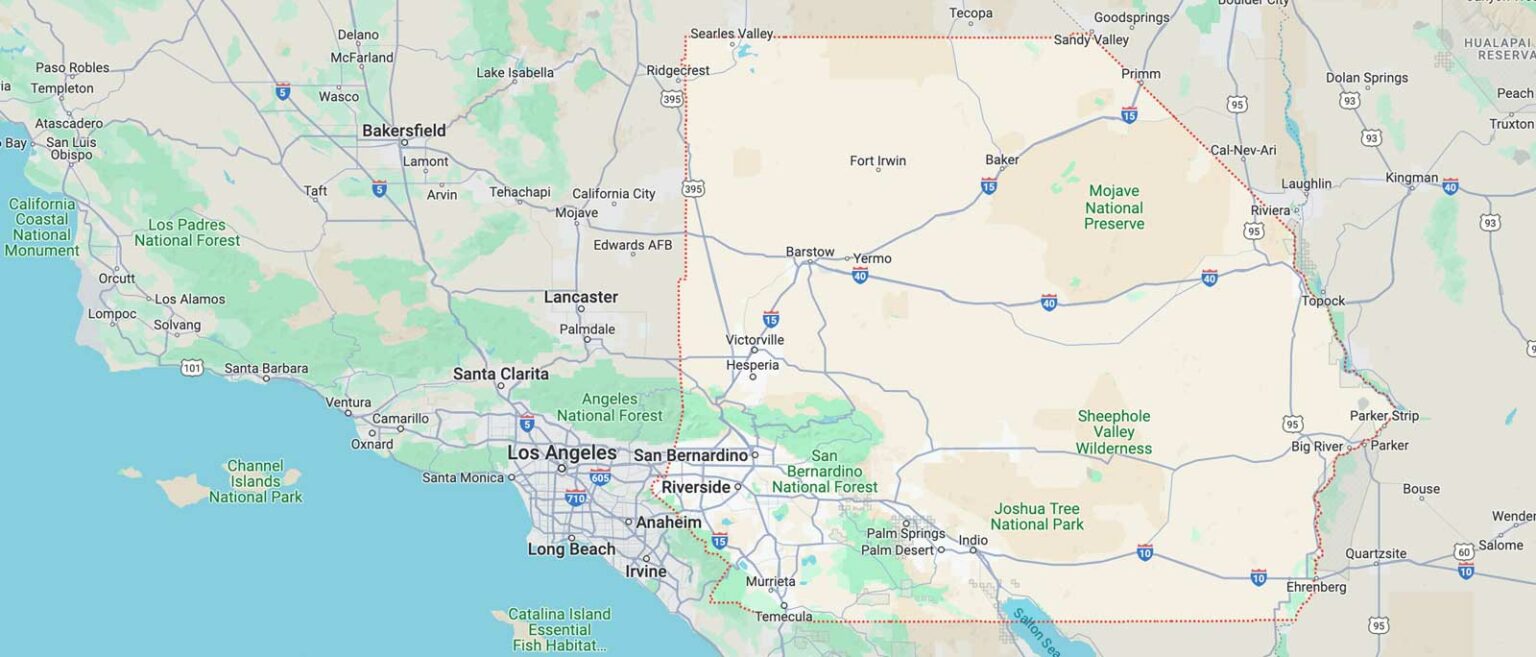
This section contains a map of each assessment area showing the boundaries of the area and identifying the geographies contained within the area, either on the map or in a separate list.
Bank’s Assessment Areas
MSA 31080 (Los Angeles‐Long Beach‐Anaheim, CA Metropolitan Statistical Area)
MD 31084 (Los Angeles‐Long Beach‐Glendale, CA Metropolitan Division)
Los Angeles County, CA.
MD 11244 (Anaheim‐Santa Ana‐Irvine, CA Metropolitan Division)
Orange County, CA.
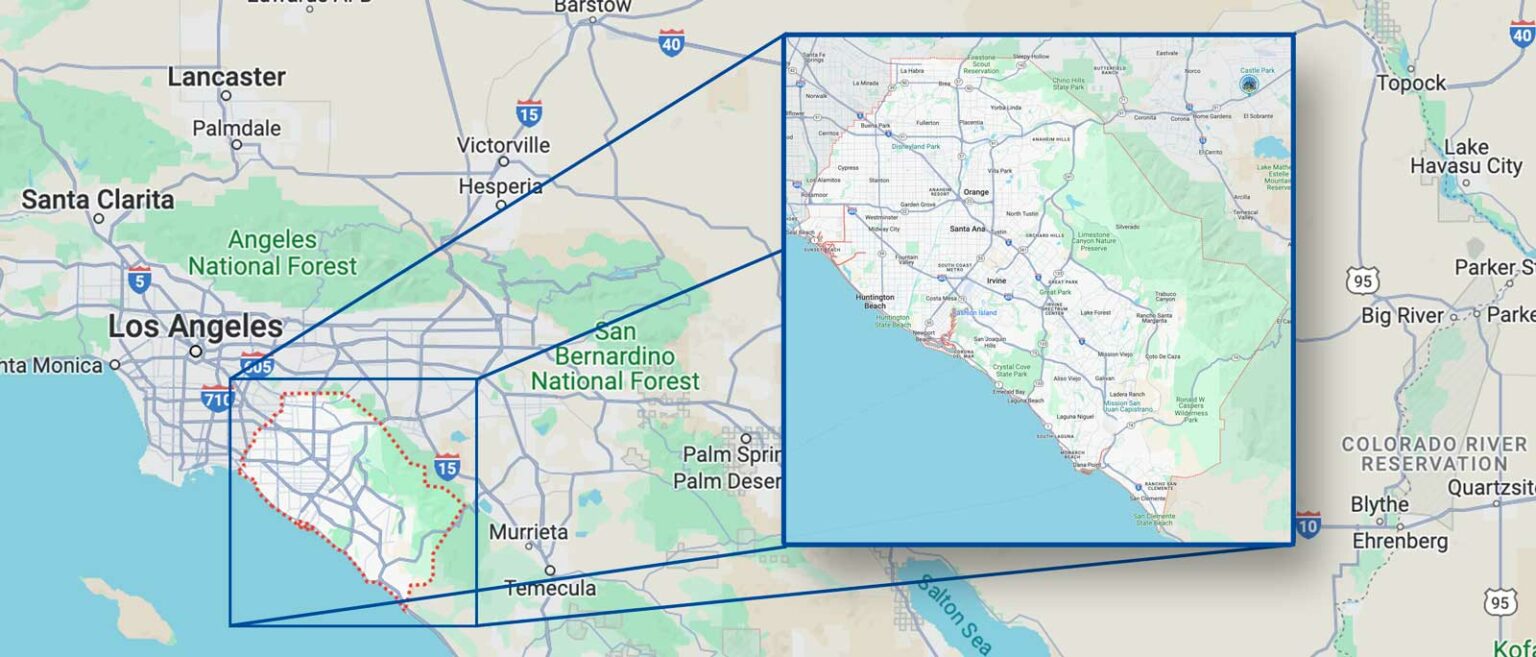
MSA 40140 (Riverside‐San Bernardino‐Ontario, CA Metropolitan Statistical Area)
This section contains the Bank’s net loan‐to‐deposit ratio for each quarter of the current and prior calendar year.
| All Figures Are In 000s | ||||||
Figures are from the Community Commerce Bank’s Report on Condition and Income (Call Report) that is filed quarterly in accordance with guidelines set forth by the Federal Financial Institution Examination Council (FFIEC). Call Reports are available to the public through the FFIEC website (https://cdr.ffiec.gov/public/).
1. Net loan figures are denoted in Call Report Schedule RC (Balance Sheet) under Items 4.a. (Loans and leases held for sale) and 4.d. (Loans and leases held for investment, net of allowance).
2. Total deposit figures are denoted in Call Report Schedule RC (Balance Sheet) under Item 13.a. (Deposits in domestic offices).
3. The Bank’s key ratios along with peer group comparisons are denoted in the FFIEC Uniform Bank Performance Report (UPBR). The quarterly report is available to the public through the FFIEC website listed above.
This section contains any other information the Bank deems pertinent to its CRA Public File.
No Other Information At This Time

Our Branches and Customer Service will be closing at 12pm PDT on Friday, April 3rd for Good Friday.
Our Branches and Customer Service will be closed Tuesday, March 31st in observance of Cesar Chavez Day.
Our Branches and Customer Service will be closed Monday, May 25th for Memorial Day.
Our Branches and Customer Service will be closed Friday, June 19th for Juneteenth.
Our Branches and Customer Service will be closed Friday, July 3rd in Observance of Independence Day.
Our Branches and Customer Service will be closed Monday, September 7th for Labor Day.
Our Branches and Customer Service will be closed Monday, October 12th for Columbus Day.
Our Branches and Customer Service will be closed on Wednesday, November 11th in honor of Veterans Day.
Our Branches and Customer Service will be closed Thursday, November 26th & Friday, November 27th for Thanksgiving.
Our Branches and Customer Service will close at 12pm PST on Thursday, Dec 24th and all day Friday, Dec 25th for Christmas.
Our Branches and Customer Service will close at 12pm PST on Tuesday, Dec 31st and all day Wednesday, Jan 1st for New Years.
Our Branches and Customer Service will be closed on Monday, January 19th in observance of Martin Luther King Jr. Day.
Our Branches and Customer Service will be closed Monday, February 16th for Presidents' Day.
Our Branches and Customer Service will close at 12pm PST on Thursday, Dec 31st and all day Friday, Jan 1st for New Years.